Just a short tutorial on using perf and friends to figure out where to start with optimizations. Our example will be dmd compiling the release build of libphobos2.so.
First of all figuring out the command we’re interested in.
cd phobos
make -f posix.mak | grep -F libphobos2.so
../dmd/src/dmd -conf= -I../druntime/import -w -dip25 -m64 -fPIC -O -release -shared -debuglib= -defaultlib= -ofgenerated/linux/release/64/libphobos2.so.0.73.0 -L-soname=libphobos2.so.0.73 ../druntime/generated/linux/release/64/libdruntime.so.a -L-ldl std/array.d std/ascii.d std/base64.d std/bigint.d std/bitmanip.d ...
perf-stat
A very good start to get a high-level overview is
perf stat
to obtain CPU event counts.
perf stat -r 5 -- ../dmd/src/dmd -conf= -I../druntime/import -w ...
       2932.072376      task-clock (msec)         #    0.968 CPUs utilized            ( +-  0.34% )
                13      context-switches          #    0.004 K/sec                    ( +-  2.92% )
                 3      cpu-migrations            #    0.001 K/sec
           230,120      page-faults               #    0.078 M/sec                    ( +-  0.00% )
    10,942,586,352      cycles                    #    3.732 GHz                      ( +-  0.34% )  (34.19%)
    14,322,043,503      instructions              #    1.31  insn per cycle           ( +-  0.06% )  (50.00%)
     3,009,171,058      branches                  # 1026.295 M/sec                    ( +-  0.30% )  (32.70%)
        78,587,057      branch-misses             #    2.61% of all branches          ( +-  0.24% )  (30.76%)

       3.029178061 seconds time elapsed
It will already color numbers that are extremely off.
toplev
toplev is another great tool to get a more detailed and better understandable high-level overview.
./toplev.py --level 2 taskset -c 0 -- ../dmd/src/dmd -conf= -I../druntime/import -w ...
C0    FE      Frontend_Bound:                             34.75 %           [  2.92%]
    This category represents slots fraction where the
    processor's Frontend undersupplies its Backend...
    Sampling events:  frontend_retired.latency_ge_8:pp
C0    FE      Frontend_Bound.Frontend_Latency:            24.38 %           [  2.92%]
    This metric represents slots fraction the CPU was stalled
    due to Frontend latency issues...
    Sampling events:  frontend_retired.latency_ge_16:pp frontend_retired.latency_ge_32:pp
C0    BAD     Bad_Speculation:                            14.05 %           [  2.92%]
C0    BAD     Bad_Speculation.Branch_Mispredicts:         13.65 %           [  2.92%]
    This metric represents slots fraction the CPU has wasted due
    to Branch Misprediction...
    Sampling events:  br_misp_retired.all_branches
C0-T0         MUX:                                         2.92 %
    PerfMon Event Multiplexing accuracy indicator
C1    FE      Frontend_Bound:                             42.02 %           [  2.92%]
C1    FE      Frontend_Bound.Frontend_Latency:            31.16 %           [  2.92%]
C1-T0         MUX:                                         2.92 %
C2    FE      Frontend_Bound:                             40.71 %           [  2.92%]
C2    FE      Frontend_Bound.Frontend_Latency:            34.68 %           [  2.92%]
C2    BAD     Bad_Speculation:                            10.23 %           [  2.92%]
C2    BAD     Bad_Speculation.Branch_Mispredicts:          9.66 %           [  2.92%]
C2    BE      Backend_Bound:                              35.74 %           [  2.92%]
C2    BE/Mem  Backend_Bound.Memory_Bound:                 21.60 %           [  2.92%]
    This metric represents slots fraction the Memory subsystem
    within the Backend was a bottleneck...
C2    RET     Retiring:                                   13.77 %           [  2.92%]
C2    RET     Retiring.Microcode_Sequencer:                8.49 %           [  5.84%]
    This metric represents slots fraction the CPU was retiring
    uops fetched by the Microcode Sequencer (MS) unit...
    Sampling events:  idq.ms_uops
C2-T0         MUX:                                         2.92 %
C3    FE      Frontend_Bound:                             36.71 %           [  2.92%]
C3    FE      Frontend_Bound.Frontend_Latency:            45.72 %           [  2.93%]
C3    BAD     Bad_Speculation:                            11.72 %           [  2.92%]
C3    BAD     Bad_Speculation.Branch_Mispredicts:         11.28 %           [  2.91%]
C3    BE      Backend_Bound:                              37.37 %           [  2.92%]
C3    BE/Mem  Backend_Bound.Memory_Bound:                 23.81 %           [  2.92%]
C3    RET     Retiring:                                   13.83 %           [  2.92%]
C3    RET     Retiring.Microcode_Sequencer:                8.74 %           [  5.84%]
C3-T0         MUX:                                         2.91 %
C0-T1         MUX:                                         2.92 %
C1-T1         MUX:                                         2.92 %
C2-T1         MUX:                                         2.92 %
C3-T1         MUX:                                         2.91 %
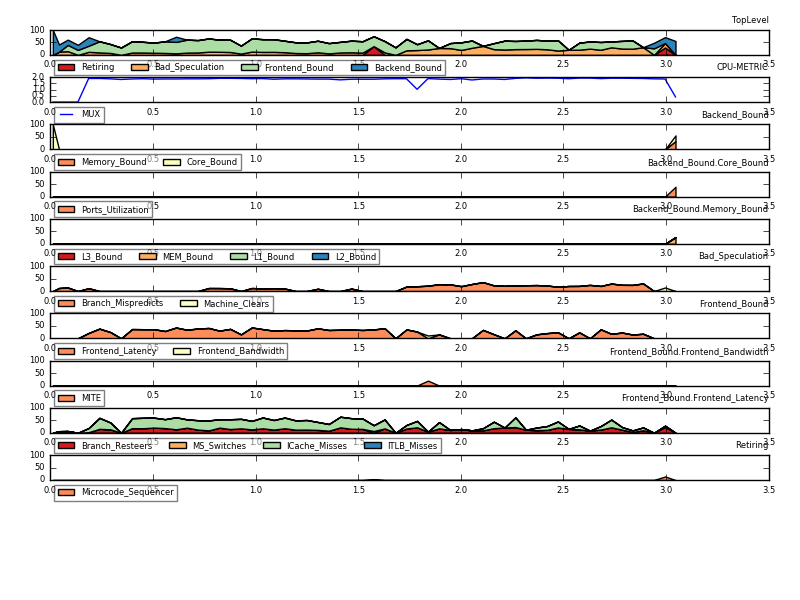
The level of detail can be selected using --level X (with X from 1-5), also see Selecting the right level and multiplexing, and it can record and plot events over time.
./toplev.py --level 3 taskset -c 0 -I 10 -o -x, x.csv -- ../dmd/src/dmd -conf= -I../druntime/import  -w ...
./tl-barplot.py x.csv --cpu C0-T0 -o toplev_dmd_barplot.png
perf-record
perf record
is the workhorse for drilling down into performance problems up to
instruction level.
The basic work-flow is recording events and then using the interactive perf-report to analyze them.
perf record -- ../dmd/src/dmd -conf= -I../druntime/import  -w ...
perf report
Another interesting mode is recording call-graphs.
perf record -g -- ../dmd/src/dmd -conf= -I../druntime/import  -w ...
perf report
It’s useful to play around with the --freq= option to collect more sample, and the --event= option to gather other events than the default cycles, e.g. branch-misses. Ask perf list for all available events.
While neither of perf-record’s call-graph collection methods, frame pointers or DWARF backtraces, works for all of dmd, using frame pointers (perf record -g or perf record --call-graph fp instead of perf record --call-graph dwarf) captures most of it.
FlameGraph
The latest addition in my optimization toolbox is CPU Flame Graphs, a bunch of scripts to visualize profiles with call-graphs.
After converting the profiler specific stacktraces (stackcollapse-perf.pl for perf), flamegraph.pl will generate an interactive svg file.
We limit the stack depth to not kill the browser or svg viewer.
perf script --max-stack 24 | ./stackcollapse-perf.pl > profile.folded
# less profile.folded
./flamegraph.pl profile.folded > profile.svg
